

A traders main task is to observe the price movements and then open a transaction based on these observations. Sometimes a strong trend is visible on the price chart and the situation is quite clear then. But on other occasions, the trend is weak or the price consolidates. One way to deal with them is to search for divergences. Many do not know how to react to such circumstances. And this is the subject of todays post.
What is the divergence?
To spot the divergence you will have to use special technical analysis tools that are called oscillators. There are a few you can choose from on the Quotex platform. They will differ slightly. The main rules remain, however, identical.

A trader has a few possibilities when it comes to identifying the trend. He can simply draw a trend line. He can also analyse various time frames and draw conclusions. And he can use a moving average too. The trend can be strong or weak. To discover its strength we can use a convergence.
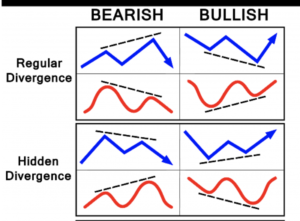
The convergence happens when a particular oscillator and the price are both rising or both falling. During the uptrend, both, the price and the oscillator may create a high and then another one which is higher in comparison to the first one. During the downtrend, they can form a low and then one more that is lower than the latest one.
The situation when only the price makes a higher high and the oscillator form a lower high during the uptrend is called a divergence. Similarly, when the price forms a lower low, but the oscillator makes a higher low during the downtrend. You can assume the trend is weakening and most likely will reverse in the near future.
Some of the oscillators offered by Quotex are
You can apply different kinds of oscillators in order to spot divergence. One of them is the Moving Average Convergence Divergence (MACD). You can see the exemplary chart with the MACD below. The price is falling and creating a lower low while the MACD is moving up and making a higher low. It can be taken as a signal of the reversal of the trend.
The Stochastic Oscillator is another example of the oscillator you can utilise. On the chart below, there is a downtrend again. But only the price is moving downwards. The Stochastic is rising. The trend will reverse soon.
Best entry points when trading with the divergence
Many traders consider the signals obtained from the divergences as not strong enough. They argue that the oscillator may show divergence for a long while before the trend really reverses. So the question is when you should open a transaction.
In order to find the best entry points with divergences, you ought to follow the candlestick patterns and implement price action techniques. For example, you can watch for a pin bar at the top of the uptrend or the bottom of the downtrend and enter the trade right after it.
The Relative Strength Index (RSI) is yet another oscillator that can be a great help in spotting the divergence. Take a look at the chart below. The RSI is showing the divergence. Now observe the price bars. The double top pattern has formed. It gives you a confirmation of a good moment to enter the trade
The oscillators help you to notice a divergence. The divergence is not something that happens all the time. At times, it can be a difficult task to spot it. But once you have it visible, you can expect the trend will reverse soon. To identify the best entry points, use extra techniques like recognising the candlestick patterns.
Quotex offers a practice account. It cost you nothing to open it. Moreover, it is replenished with virtual cash so all the transactions you make there are without any risk. This is a perfect place where you can practice identifying the divergences and finding the points of entry for your transactions that will bring you profit.
Tell us in the comments section below about your experience with the divergences. I would be happy to hear from you.