


A traders main task is to observe the price movements and then open a transaction based on these observations. Sometimes a strong trend is visible on the price chart and the situation is quite clear then. But on other occasions, the trend is weak or the price consolidates. One way to deal with them is to search for divergences. Many do not know how to react to such circumstances. And this is the subject of todays post.
What is the divergence?
To spot the divergence you will have to use special technical analysis tools that are called oscillators. There are a few you can choose from on the Quotex platform. They will differ slightly. The main rules remain, however, identical.
A trader has a few possibilities when it comes to identifying the trend. He can simply draw a trend line. He can also analyse various time frames and draw conclusions. And he can use a moving average too. The trend can be strong or weak. To discover its strength we can use a convergence.
The convergence happens when a particular oscillator and the price are both rising or both falling. During the uptrend, both, the price and the oscillator may create a high and then another one which is higher in comparison to the first one. During the downtrend, they can form a low and then one more that is lower than the latest one.
The situation when only the price makes a higher high and the oscillator form a lower high during the uptrend is called a divergence. Similarly, when the price forms a lower low, but the oscillator makes a higher low during the downtrend. You can assume the trend is weakening and most likely will reverse in the near future.
Some of the oscillators offered by Quotex
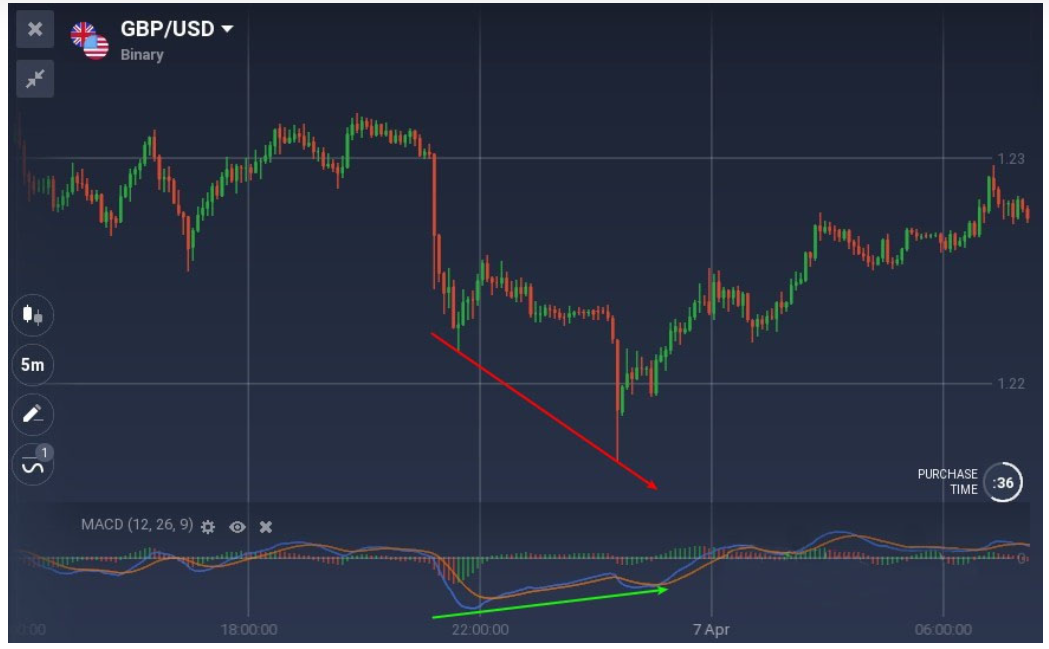
You can apply different kinds of oscillators in order to spot divergence. One of them is the Moving Average Convergence Divergence (MACD). You can see the exemplary chart with the MACD below. The price is falling and creating a lower low while the MACD is moving up and making a higher low. It can be taken as a signal of the reversal of the trend.
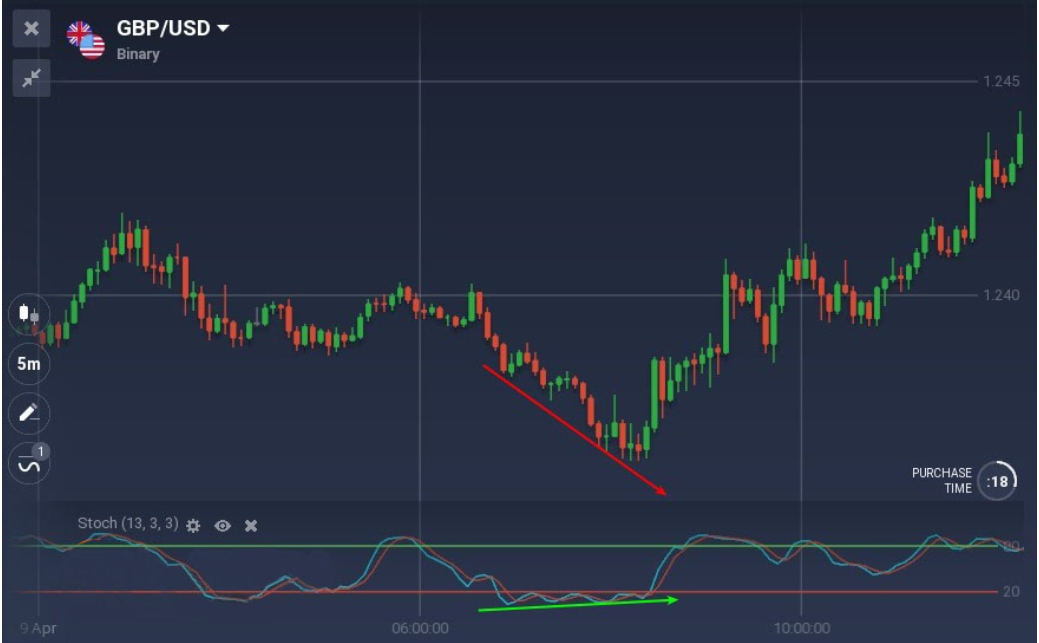
Another type of oscillator that you might use is the stochastic oscillator. A decline may be seen once more on the chart below. However, just the price is falling. Stochastic is increasing. The pattern will shortly change.
Best entry points when trading with the divergence
Many traders believe that the signals derived from divergences are insufficiently strong. They contend that before the trend actually reverses, the oscillator may exhibit divergence for a considerable amount of time. The dilemma then becomes when to start a transaction.
You should use price action strategies and stick to candlestick patterns in order to discover the best entry points with divergences. For instance, you might look for a pin bar at the peak of an uptrend or the trough of a downtrend and place your trade immediately after it.

Another oscillator that might be quite useful in identifying the divergence is the Relative Strength Index (RSI). Check out the graph below. The divergence is visible on the RSI. Watch the price bars now. The pattern of a double top has emerged. It provides you with confirmation that now is a suitable time to start the trade.

Summary
The oscillators aid in the detection of a divergence. It doesn’t always happen that there will be a divergence. Finding it can occasionally be a challenge. Yet, once it is apparent, you may anticipate that the tendency will soon change. Use additional strategies, such as candlestick pattern recognition, to find the optimum entry points.
A practise account is provided by Quotex. You paid nothing to access it. Additionally, it is continually refilled with virtual money, making all of your transactions there risk-free. This is the ideal situation to practise spotting divergences and locating the points of entry for your profitable deals.
Inform us about your encounters with the divergences in the comments section below. I look forward to hearing from you.
FAQS
