Bollinger Bands are a widely used technical analysis tool developed by John Bollinger in the 1980s. They are used to measure the volatility of an asset and to identify potential price reversals. In this article, we will explore what Bollinger Bands are, how to use them, and the various trading strategies that utilize this tool.
What is Bollinger Band Strategy?
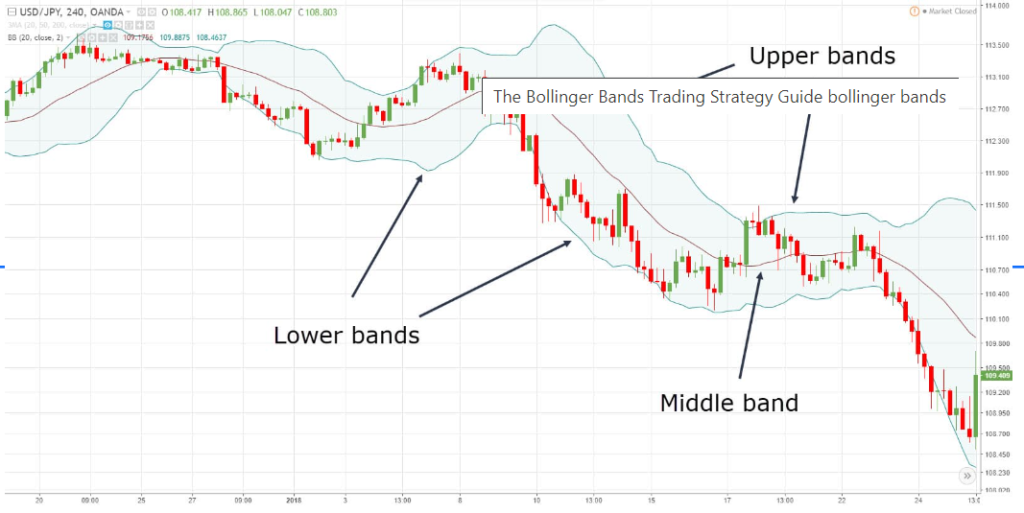
Bollinger Bands are composed of three lines – a simple moving average (SMA) line in the middle, and two outer bands that are two standard deviations away from the SMA. The upper band represents the upper price target and the lower band represents the lower price target. The distance between the bands widens and narrows based on the volatility of the asset being analyzed.
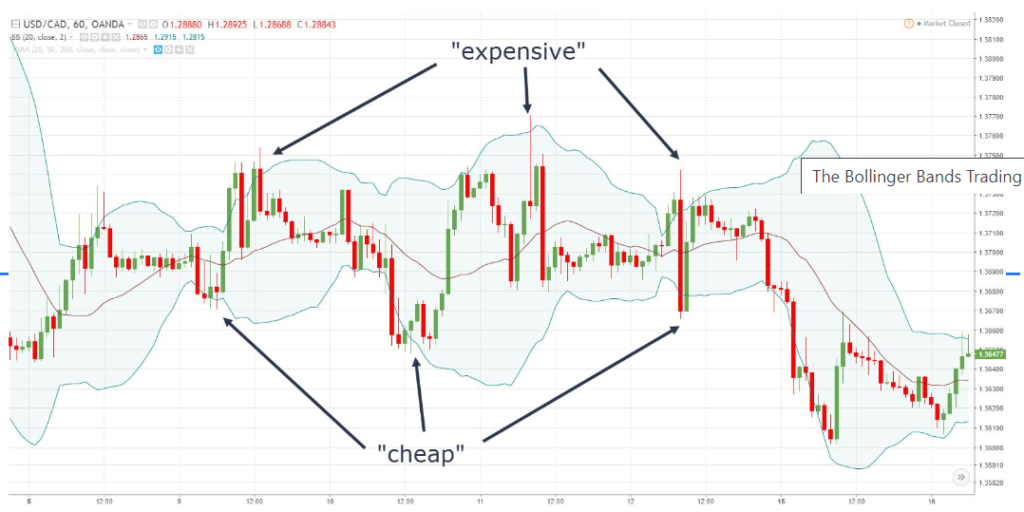
The Bollinger Band strategy involves using the upper and lower bands as potential resistance and support levels, respectively. When the price of the asset touches the upper band, it is considered overbought, and a potential sell signal may be generated. When the price touches the lower band, it is considered oversold, and a potential buy signal may be generated.

How to Trade Bollinger Bands?
The first step in trading with Bollinger Bands is to identify the trend of the asset. This can be done by analyzing the SMA line. If the SMA is sloping upward, it indicates an uptrend, and if it is sloping downward, it indicates a downtrend.
Once the trend has been identified, traders can look for potential entry and exit points using the upper and lower bands. For example, in an uptrend, traders may wait for the price to touch the lower band and then buy the asset, anticipating a rebound back up towards the upper band. In a downtrend, traders may wait for the price to touch the upper band and then sell the asset, anticipating a rebound back down towards the lower band.
Bollinger Bands Trading Strategies that Work
There are several Bollinger Bands trading strategies that have proven to be effective over time. One popular strategy is the Bollinger Squeeze, which occurs when the bands narrow, indicating a period of low volatility. When the bands then widen again, it signals a potential breakout, and traders may enter a long or short position depending on the direction of the breakout.
Another effective strategy is the Bollinger Band Breakout, which involves waiting for the price to break through one of the bands before entering a trade. If the price breaks through the upper band, traders may enter a short position, and if it breaks through the lower band, traders may enter a long position.

Bollinger Band Stock Strategy
Bollinger Bands are commonly used in stock trading to identify potential buy and sell signals. Traders can use the bands to determine when a stock is overbought or oversold and may be due for a price reversal. Additionally, the Bollinger Squeeze strategy can be particularly effective in identifying potential breakouts in stocks.
Bollinger Band Trading System
A Bollinger Band trading system is a set of rules and guidelines that traders can use to make decisions based on the signals generated by the Bollinger Bands. The system may include specific entry and exit points, as well as rules for managing risk and protecting profits. Traders may also use additional indicators, such as the Relative Strength Index (RSI), in conjunction with the Bollinger Bands to confirm potential signals.

Bollinger Bands Intraday Trading Strategy
Intraday trading, which involves buying and selling assets within the same trading day, can be particularly well-suited for the Bollinger Bands strategy. Traders can use the bands to identify potential entry and exit points for short-term trades. The Bollinger
Bands can also be used to set stop-loss orders to manage risk and protect profits.
Bollinger Bands Forex Trading Strategy
Bollinger Bands are also commonly used in forex trading, where they can be particularly effective in identifying potential breakouts in currency pairs. The Bollinger Band Breakout strategy can be particularly useful in forex trading, as traders can enter positions when the price breaks through one of the bands and then ride the trend in the direction of the breakout.
Bollinger Bands Crypto Trading Strategy
Crypto trading is another area where Bollinger Bands can be useful. As with stocks and forex, traders can use the bands to identify potential buy and sell signals, as well as to set stop-loss orders to manage risk. The high volatility of many cryptocurrencies can make the Bollinger Bands strategy particularly effective in this market.
Is Bollinger Bands a Good Indicator?
The effectiveness of the Bollinger Bands strategy depends on a number of factors, including the volatility of the asset being analyzed, the timeframe being used, and the trader’s ability to interpret signals generated by the bands. However, Bollinger Bands are widely used and have a strong track record of effectiveness in a variety of markets, making them a popular and reliable technical analysis tool.

Bollinger Bands are a popular technical analysis tool used by traders to identify potential price reversals and generate trading signals. However, like any trading tool, it’s important to understand the strengths and weaknesses of Bollinger Bands to determine if they are a good fit for your trading strategy.
First, let’s examine the Bollinger Bands formula. The indicator consists of a moving average line and two bands that are plotted two standard deviations away from the moving average. The formula is as follows:
Upper Band = Moving Average + (2 x Standard Deviation)
Lower Band = Moving Average – (2 x Standard Deviation)
The standard deviation measures the amount of variability or dispersion in a set of data. In this case, it measures the volatility of the market. The wider the distance between the upper and lower bands, the higher the volatility.
So, are Bollinger Bands good for trading?
The answer is that it depends on the market conditions and your trading style. Bollinger Bands can be useful in trending and range-bound markets, but they may not be effective during periods of low volatility or choppy markets.
For scalping strategies, traders often use Bollinger Bands in conjunction with other indicators such as the Relative Strength Index (RSI) to identify overbought or oversold conditions. A common scalping strategy involves buying when the price touches the lower band and selling when it touches the upper band.
For swing trading, traders may use longer time frames and adjust the Bollinger Bands settings accordingly. The best settings for swing trading depend on the market being traded and the trader’s risk tolerance. A common setting is a 20-period moving average with two standard deviations.
Bollinger Band breakout strategy
Bollinger Band breakout is a popular trading strategy that is often used by traders to identify potential price movements in the market. A Bollinger Band breakout occurs when the price of an asset breaks through the upper or lower Bollinger Band.
To understand Bollinger Band breakout, let’s first look at how Bollinger Bands are constructed. Bollinger Bands consist of a simple moving average (SMA) line in the middle and two bands above and below the SMA line. The upper band is constructed by adding two standard deviations to the SMA line, and the lower band is constructed by subtracting two standard deviations from the SMA line.

When the price of an asset moves above the upper Bollinger Band, it is considered overbought, and when the price moves below the lower Bollinger Band, it is considered oversold. Traders often use Bollinger Bands in conjunction with other technical indicators, such as the Relative Strength Index (RSI) or the Moving Average Convergence Divergence (MACD), to confirm potential breakouts.
A Bollinger Band breakout occurs when the price of an asset breaks through the upper or lower Bollinger Band. Traders often use this as a signal to enter a trade, with a long position being initiated when the price breaks through the upper Bollinger Band and a short position being initiated when the price breaks through the lower Bollinger Band.
It’s important to note that a Bollinger Band breakout does not necessarily indicate a trend reversal. It could simply mean that the price of the asset is experiencing a temporary spike or dip. Traders often use other technical indicators, such as moving averages or trend lines, to confirm trend reversals.
When using the Bollinger Band breakout strategy, traders should also be mindful of risk management. As with any trading strategy, there is always a risk of losses, and traders should have a plan in place to manage their risk.
Conclusion
Bollinger Bands are a powerful technical analysis tool that can be used to identify potential buy and sell signals, as well as to manage risk and protect profits. There are several Bollinger Bands trading strategies that have proven to be effective over time, including the Bollinger Squeeze and Bollinger Band Breakout strategies. Whether you are trading stocks, forex, or cryptocurrencies, Bollinger Bands can be an invaluable tool in your trading arsenal. As with any trading strategy, it is important to do your research, practice proper risk management, and stay disciplined in your trading approach.


