


The Relative Strength Index (RSI) is a popular technical analysis indicator that helps traders identify trends and momentum in the market. Developed by J. Welles Wilder Jr. in 1978, RSI measures the strength of price action relative to its previous price movements.
How the RSI Works
RSI is a momentum oscillator that ranges from 0 to 100. The higher the RSI reading, the stronger the price action. Conversely, a lower RSI reading indicates weaker price action. RSI compares the magnitude of recent gains to recent losses to calculate its value.
Why Is RSI Important?
RSI is an important indicator because it helps traders identify overbought or oversold conditions. This information can help traders make more informed decisions about when to buy or sell an asset. Additionally, RSI can be used in conjunction with other technical analysis tools to confirm trends or identify potential reversals.

Using RSI With Trends
When used with trends, RSI can help traders identify whether a trend is strong or weakening. If the RSI reading is consistently above 50, it indicates that the trend is strong. Conversely, if the RSI reading is consistently below 50, it suggests that the trend is weak.
Overbought or Oversold
When RSI readings exceed 70, it suggests that the asset is overbought, and traders should be cautious about buying the asset at that price. Similarly, when RSI readings fall below 30, it suggests that the asset is oversold, and traders should be cautious about selling the asset at that price.
How to Use RSI Indicator
To use the RSI indicator, traders can set the RSI range according to their trading strategy. The standard range is 14 periods, but traders can adjust this based on their trading style. Generally, a shorter period is more appropriate for intraday trading, while a longer period is better for long-term trading.

RSI Ranges
The RSI range is from 0 to 100, with readings above 70 indicating overbought conditions and readings below 30 indicating oversold conditions. Traders can also use the 50 level as a signal of bullish or bearish market sentiment. If the RSI reading is above 50, it indicates that the market is bullish, while a reading below 50 suggests that the market is bearish.
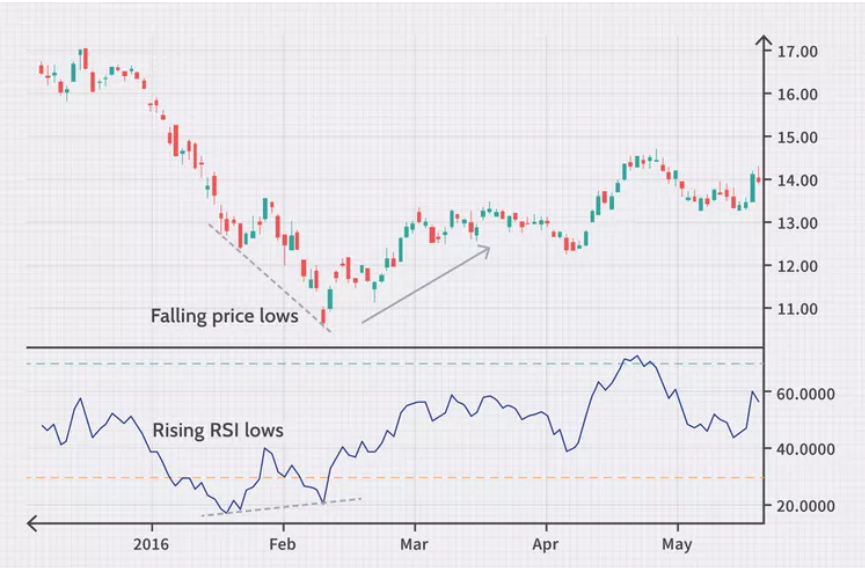
RSI Divergences
RSI divergences occur when the RSI indicator moves in the opposite direction of the asset’s price. This can be an indication of a potential trend reversal. For example, if the asset’s price is rising, but the RSI indicator is falling, it suggests that the trend may be weakening.
Positive-Negative Reversals
Positive-negative reversals occur when the RSI indicator moves from a positive to a negative reading. This can be a signal of a trend reversal. Conversely, negative-positive reversals occur when the RSI indicator moves from a negative to a positive reading, indicating a potential trend reversal.
How to Use RSI Indicator for Intraday Trading
To use the RSI indicator for intraday trading, traders can set the RSI range to a shorter period, such as 5 or 10 periods. This allows traders to identify shorter-term trends and potential trading opportunities.
How to Use RSI Indicator for Trading
To use the RSI indicator for trading, traders can use the RSI range and overbought/oversold conditions to identify potential entry and exit points. For example, if the RSI reading is above 70, it suggests that the asset is overbought, and traders may consider selling the asset. Conversely, if the RSI reading is below 30, it suggests that the asset is oversold, and traders may consider buying the asset.
RSI Indicator Settings
Traders can adjust the RSI indicator settings to fit their trading style and the asset they are trading. Some traders may prefer a shorter RSI range for more frequent trading opportunities, while others may prefer a longer range for more long-term trading. It’s important to backtest different settings to determine which works best for your trading strategy.
RSI Swing Rejections
RSI swing rejections occur when the RSI indicator fails to reach a new high or low, indicating a potential trend reversal. This can be a useful signal for traders to exit a trade or consider a new trade in the opposite direction.

RSI vs. MACD
RSI and Moving Average Convergence Divergence (MACD) are both popular technical analysis indicators. While RSI focuses on momentum and overbought/oversold conditions, MACD is used to identify trend reversals and confirm trends. Traders may use both indicators together to get a more comprehensive view of the market.

RSI vs and Stochastic
both popular technical indicators used in technical analysis to identify potential buying and selling opportunities in the market. However, they differ in their calculations and interpretations.
RSI is a momentum oscillator that measures the speed and change of price movements. It compares the average price gains and losses over a specified period, typically 14 days, and calculates a value between 0 and 100. A value above 70 is considered overbought, indicating a potential price reversal to the downside, while a value below 30 is considered oversold, indicating a potential price reversal to the upside.
On the other hand, Stochastic is also a momentum oscillator that measures the location of the current price relative to the high-low range over a specified period, typically 14 days. It calculates two lines: %K and %D, where %K represents the current price relative to the high-low range, and %D represents a moving average of %K. Stochastic values range between 0 and 100, with values above 80 considered overbought and values below 20 considered oversold.
In summary, RSI and Stochastic are both momentum oscillators that measure the speed and change of price movements. However, RSI compares average price gains and losses, while Stochastic compares the current price to the high-low range. Both indicators can be useful in identifying potential buying and selling opportunities, but traders should use them in conjunction with other technical and fundamental analysis tools to make informed trading decisions.
Limitations
While RSI can be a useful tool for traders, it has its limitations. RSI can sometimes provide false signals, particularly in ranging markets. Additionally, RSI can be less effective in markets with high volatility.
RSI FAQs
What is a good RSI reading?
- A good RSI reading depends on the trading strategy and the asset being traded. Generally, an RSI reading above 50 indicates bullish market sentiment, while a reading below 50 suggests bearish sentiment.
What is the best RSI range for intraday trading?
- The best RSI range for intraday trading depends on the trader’s strategy and the asset being traded. Some traders may prefer a shorter range, such as 5 or 10 periods, while others may prefer a longer range, such as 14 or 21 periods.
Can RSI be used for all assets?
- RSI can be used for all assets, including stocks, commodities, and currencies. However, traders may need to adjust the RSI settings depending on the volatility and trading style of the asset.
In conclusion, the Relative Strength Index (RSI) is a powerful tool that can help traders identify trends and momentum in the market. By using RSI in conjunction with other technical analysis indicators, traders can gain a more comprehensive view of the market and make more informed trading decisions. However, it’s important to keep in mind the limitations of RSI and to adjust the indicator settings to fit your trading strategy and the asset being traded.