

Technical indicators are valuable tools for traders to identify potential trading opportunities in the financial markets. One of the most popular indicators is the zig zag indicator, which helps traders identify price trends and chart patterns. In this article, we will discuss how to use the zig zag indicator, its settings, and secrets to help you make informed trading decisions.
What is a Zig Zag Indicator?
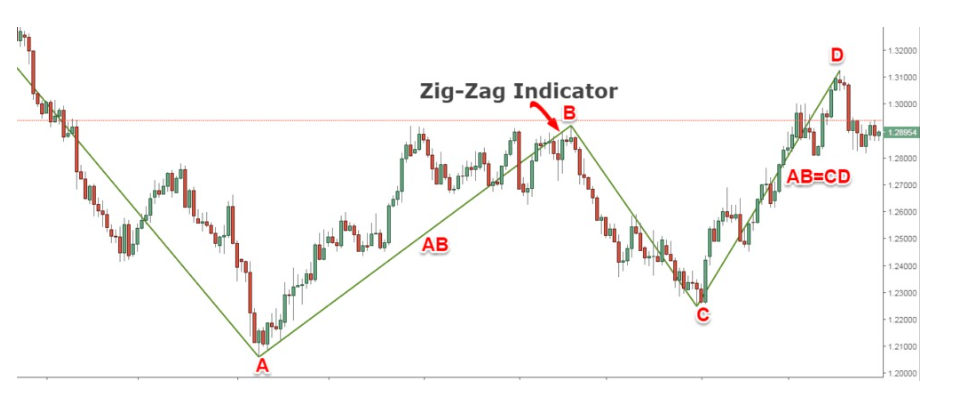
The zig zag indicator is a technical analysis tool that is used to identify changes in price trends. It does this by filtering out market noise and highlighting the most important price movements. It is an excellent tool for traders who want to identify chart patterns, such as head and shoulders, double tops, and bottoms, among others.
The Zig Zag indicator consists of a series of lines that connect the price highs and lows of an asset. It then draws a zigzag line on the chart that reflects the changes in price movements. The zig zag indicator is best used in combination with other technical indicators, such as moving averages and oscillators, to confirm trading signals.
Zig Zag Indicator Settings
The zig zag indicator has several settings that traders can adjust to suit their trading style and preferences. The most commonly used settings are the depth, deviation, and backstep. Here is a breakdown of what each setting means:
Depth: This setting determines the minimum price change required for a zig zag line to appear on the chart. The higher the depth, the more significant the price movement needs to be for the zig zag line to appear.
Deviation: This setting determines the percentage change required for a zig zag line to appear. The higher the deviation, the more significant the price movement needs to be for the zig zag line to appear.
Backstep: This setting determines the number of bars required for a zig zag line to change direction. The higher the backstep, the more significant the price movement needs to be for the zig zag line to change direction.

Zig Zag Indicator Secret
One of the secrets to using the zig zag indicator effectively is to combine it with other technical indicators. For example, you can use the zig zag indicator in combination with the relative strength index (RSI) to identify overbought and oversold conditions. When the zig zag line is in an uptrend, and the RSI is in the overbought zone, it may signal a potential reversal in the price trend.
Another secret to using the zig zag indicator is to adjust the settings based on the timeframe you are trading. For example, if you are trading on a higher timeframe, you may want to increase the depth and deviation settings to filter out market noise. Conversely, if you are trading on a lower timeframe, you may want to decrease the settings to capture more price movements.

How to Read a Zig Zag Indicator
To read a zig zag indicator, you need to understand the basic signals it generates. Here are the primary signals to look for:
Uptrend: A zig zag line that connects a series of higher highs and higher lows indicates an uptrend.
Downtrend: A zig zag line that connects a series of lower lows and lower highs indicates a downtrend.
Reversal: A zig zag line that changes direction indicates a potential reversal in the price trend.
How to Use the Zig Zag Indicator in MT4
To use the zig zag indicator in MT4, follow these steps:
- Open MT4 and select the asset you want to trade.
- Click on the “Insert” tab on the top menu and select “Indicators.”
- Select “Custom” and then “ZigZag.”
- Adjust the settings to suit your trading style and preferences.
- The zig zag indicator will appear on the chart.
What is the Most Accurate Zig Zag Indicator?
The most accurate zig zag indicator may vary depending on individual preferences and trading styles. However, the zig zag indicator that comes standard with most trading platforms is usually sufficient for most traders.
It’s essential to remember that no single indicator is foolproof, and traders should always use multiple indicators and analysis techniques to confirm trading signals and minimize

risk.
Is Zig Zag a Lagging Indicator?
The zig zag indicator is a lagging indicator, which means that it reacts to price movements after they have already occurred. It is not a predictive indicator, and traders should use it in conjunction with other technical analysis tools to confirm trading signals.
Final Thoughts
The zig zag indicator is a valuable tool for traders who want to identify price trends and chart patterns. However, traders should use it in combination with other technical analysis tools to confirm trading signals and minimize risk.
By adjusting the settings based on the timeframe and using it in conjunction with other indicators, traders can improve their chances of making profitable trades. Remember that no single indicator is foolproof, and it’s essential to practice sound risk management techniques when trading.