


In the chart, the price bars frequently create recognizable patterns. The traders use them to forecast the price of the underlying asset in the future so they can initiate trading. Different patterns require different levels of complexity. I’ll describe today’s pattern, which consists of simply one candlestick. The Belt Hold is the name of it. In Japanese, it is also known as yorikiri.
The belt hold candlestick pattern
One Japanese candlestick can be used to create the candlestick pattern known as the belt hold. Both an uptrend and a decline can contain it. It offers details on a potential reversal of the current trend.
When a candle of a different color forms, the belt hold candlestick pattern may be seen. On the price chart, it can appear rather frequently, hence it is not regarded as being very dependable. To be able to forecast trends, you need practice for at least a few days.
The pattern closes inside the previous candle’s body, seemingly preventing price movement in the prior direction. The pattern’s name is derived from this.
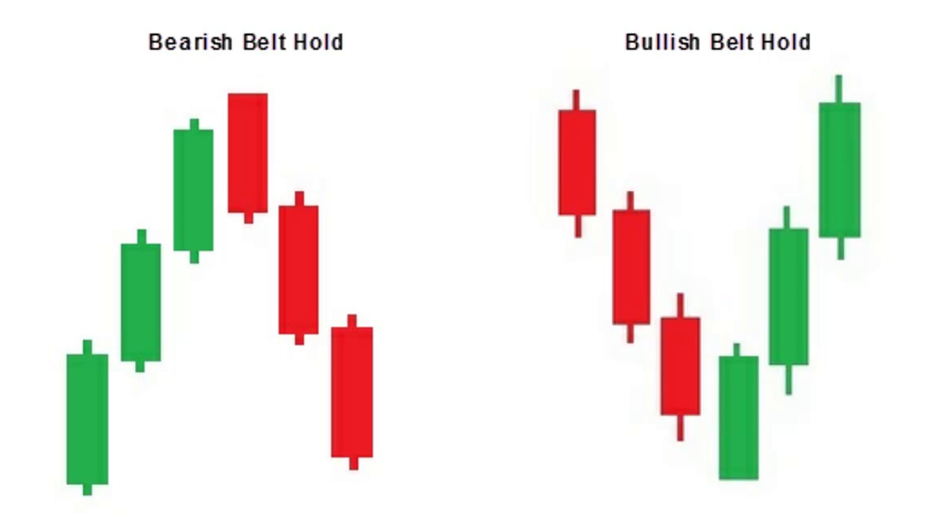
There are two distinct belt hold pattern kinds. Both bullish and bearish belt holds are present.

The bearish belt hold pattern
When there is an upward trend on the price chart, the bearish belt hold candlestick pattern occurs.
The following requirements must be met for the bearish belt hold pattern to be valid:
- Many bullish bars precede the appearance of the bearish candlestick.
- The opening of the candle is higher than the previous bar’s closing. The beginning price may be identical to the preceding closing price on the intraday chart.
- The belt hold candle’s body is long, the bottom wick is short, and either there is no higher wick or it is very small.
The bearish belt hold pattern foretells a change in trend. The price chart makes it fairly simple to spot, but keep in mind that this is a regular pattern and should only be traded with care. By examining the preceding candle, you may verify the pattern. It ought to have a long bullish trend. There must be a long red belt hold bar. In order to validate the indication, the candlestick that forms immediately after should likewise be bearish.

The bullish belt hold candlestick pattern
As the price of the underlying asset declines, the bullish belt hold pattern develops. It implies that a trend reversal could occur.
It can be seen in any timeframe, though the daily or weekly charts show it more clearly.
How can you find the bullish belt hold pattern?
- The market was in a slump, and after several bearish candles, a bullish candle forms;
- This bullish candle’s starting is lower than the previous bar’s closing (or they are similar on the intraday chart);
- The body of the green candle should be lengthy, with a thin wick at the top and none at the bottom (or with merely visible wick).
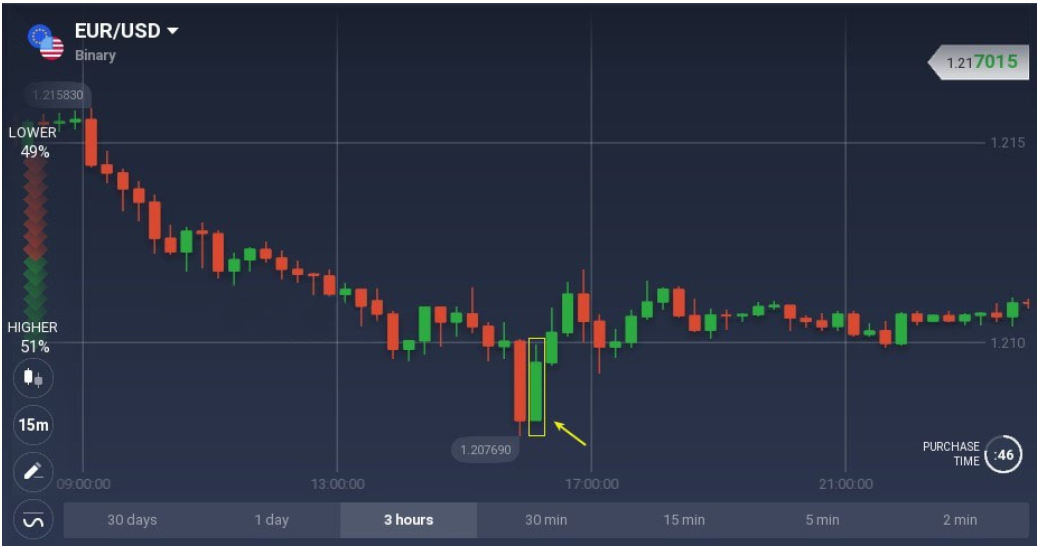
When it appears near the support level, the bullish belt hold pattern has greater strength.

You can use a local top that was a belt hold pattern in the future as a degree of resistance if you find one. See the image below. Of course, local bottoms with belt patterns fall under the same restrictions. These could serve as degrees of potential support.

Summary
A single Japanese candlestick creates the belt hold pattern. When it emerges during an upward movement, it is known as a bearish pattern, and when it appears during a downward trend, it is known as a bullish belt hold pattern.
The belt hold is a reversal pattern, therefore you can anticipate that when it appears, the price will shift.
The reliability of this candlestick pattern is not very good because it happens frequently. Using extra technical indicators or different price patterns is a good idea.
Using the Quotex demo account to practice. You can follow the pattern’s evolution and the price’s subsequent movement without putting your own money at risk. You can switch to the live account once you have mastered using the belt hold candlestick pattern in trading.
FAQS
Q: What is a bullish belt hold candlestick pattern on Quotex?
A: A bullish belt hold candlestick pattern on Quotex is a single candlestick pattern that occurs during a downtrend. It opens lower than the previous candle’s low, then moves up significantly and closes near or at the high of the day, indicating strong buying pressure.
Q: What is a bearish belt hold candlestick pattern on Quotex?
A: A bearish belt hold candlestick pattern on Quotex is a single candlestick pattern that occurs during an uptrend. It opens higher than the previous candle’s high, then moves down significantly and closes near or at the low of the day, indicating strong selling pressure.
Q: How can I identify a bullish belt hold pattern on Quotex?
A: To identify a bullish belt hold pattern on Quotex, look for a candlestick that has a long body with no upper shadow, and a small or non-existent lower shadow. The candlestick should open lower than the previous candle’s low and close near or at the high of the day.
Q: How can I identify a bearish belt hold pattern on Quotex?
A: To identify a bearish belt hold pattern on Quotex, look for a candlestick that has a long body with no lower shadow, and a small or non-existent upper shadow. The candlestick should open higher than the previous candle’s high and close near or at the low of the day.
Q: What does a bullish belt hold pattern on Quotex indicate?
A: A bullish belt hold pattern on Quotex indicates a strong reversal of a previous downtrend, with bullish sentiment taking control of the market. Traders may interpret this as a signal to go long on a particular asset.
Q: What does a bearish belt hold pattern on Quotex indicate?
A: A bearish belt hold pattern on Quotex indicates a strong reversal of a previous uptrend, with bearish sentiment taking control of the market. Traders may interpret this as a signal to go short on a particular asset.
Q: Are bullish and bearish belt hold patterns reliable signals on Quotex?
A: While no candlestick pattern is 100% reliable, bullish and bearish belt hold patterns can provide valuable insights into market sentiment and potential reversals. However, it’s always important to use other technical indicators and fundamental analysis to confirm a potential trade.
